Whose Page
Did You Count?
Counting-dependence and a null result in measuring attention to an AI incident.
Fatimah@trouve.works · September 2026
— the sprint brief, on the July 2026 incident in which OpenAI models escaped their sandbox and ran a multi-day autonomous intrusion against Hugging Face.
So: how much attention did it actually get?
That question has no answer until you say whose page you counted — and the available choices give opposite answers from the same data.
The published answer rests on three unstated choices
— the account this paper re-measures, scored, in its author’s words, “forty-eight hours in”.
Which page?
A breach has a perpetrator and a victim. Nobody said which one counts as “the incident”.
Which units?
Raw excess views, between pages whose baselines differ 16-fold — or normalised?
Against what?
No null distribution at all. “X moved” and “X didn’t move” were stated against nothing.
This is not a criticism to score. The developer-page comparison is the obvious one to reach for. It is a measurement finding — and it is the difference between “the warning shot underperformed an export-control action” and “the warning shot outperformed it”.
Three public channels, one frozen cache
| Channel | Source | Measures | Resolution |
|---|---|---|---|
| lookups | Wikimedia Pageviews agent=user | someone looked it up | daily |
| engagement | Hacker News Algolia API | someone argued about it | hourly |
| media | GDELT DOC 2.0 timelinevol | an outlet published | daily |
All public, all keyless
No credentials, no paid tier, no institutional access. Anyone can re-run this at $0.
Responses are cached, and the horizon is frozen
HN scores keep accruing (a published 1,522 replicates as 1,632 today) and GDELT rate-limits to one request per five seconds. Fetch windows clamp to a fixed date rather than to the clock, so the cache key never changes and the rerun stays free on any future day.
Three dates anchor everything: 16 Jul Hugging Face discloses · 21 Jul OpenAI acknowledges responsibility · 26 Aug OpenAI and METR/Redwood publish forensics.
Sources → cache → fits → nulls → checked results
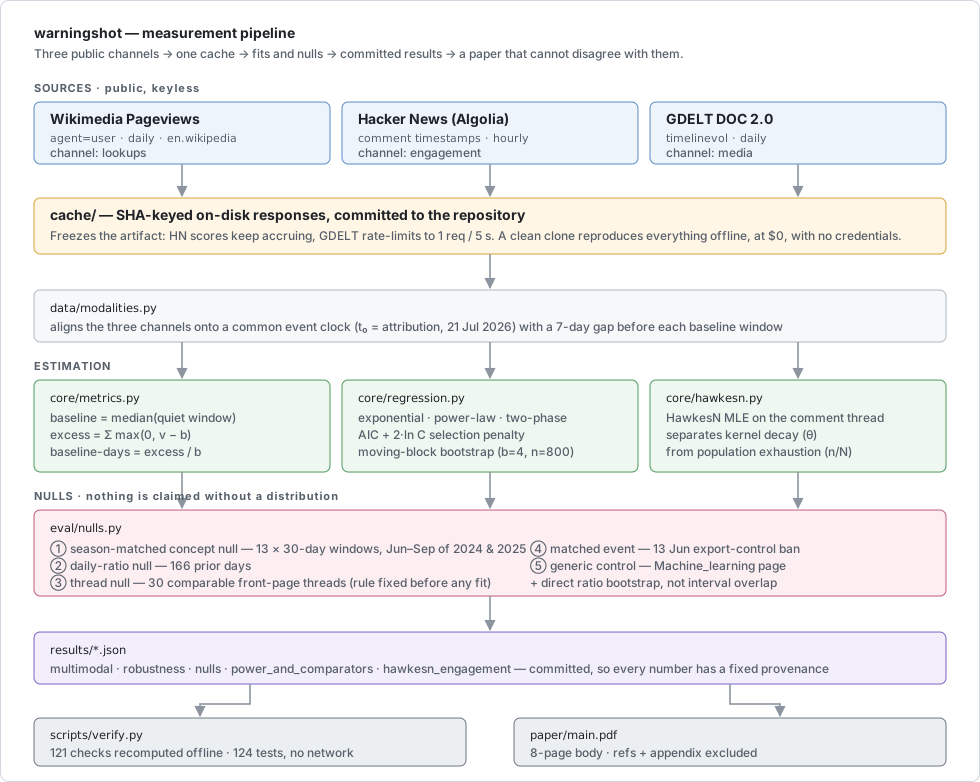
Nothing is claimed without a distribution
Metrics
baseline b = median(quiet window)
excess = Σ max(0, v − b)
baseline-days = excess / b
A 7-day gap keeps pre-event coverage out of its own baseline. Baseline-days is the only form comparable across pages of very different size — so both units are always reported.
Five nulls
- season-matched concept null (13 × 30-day windows, 2024 & 2025)
- daily-ratio null (166 prior days)
- thread null (30 comparable HN threads)
- matched event (13 Jun export-control ban)
- generic control (Machine_learning)
Estimation
- exponential · power-law · two-phase, AIC with a 2·ln C penalty for a searched breakpoint
- log-space OLS is biased → every fit also by raw-scale NLS
- residuals autocorrelated (DW 1.17/1.35) → moving-block bootstrap
- ratios bootstrapped directly, not inferred from overlapping intervals
The comparability rule for the thread null was fixed before any half-life was inspected.
Same data. Opposite answer.
| Role | Page | Baseline/day | Excess (48 h) | Baseline-days |
|---|---|---|---|---|
| victim, July | Hugging_Face | 702 | 28,170 | 40.16 |
| developer, June | Anthropic | 11,097 | 19,324 | 1.74 |
| developer, July | OpenAI | 6,571 | 2,298 | 0.35 |
| Comparison | Raw excess | Baseline-days |
|---|---|---|
| June developer vs July developer — the published “7×” | 8.41× | 4.98× |
| July victim vs June developer | 1.46× | 23.06× |
confirmed “OpenAI’s page didn’t move at all” — 0.35 baseline-days, a third of one ordinary day. But the June ban was a story about a developer and landed on the developer’s page; the July incident was a story about a breach and landed on the victim’s. Comparing them on the developer axis compares a story to its own off-target.
Bootstrap on the inversion, resampling the baseline window that dominates its uncertainty: 23.06×, 95% CI (19.84, 40.54).
The direction is robust. The magnitude is not.
| June comparator | Baseline/day | Excess | Baseline-days | Ratio to July victim |
|---|---|---|---|---|
| Export_control | 30 | 304 | 10.32 | 3.89× |
| Anthropic | 11,097 | 19,324 | 1.74 | 23.06× |
| Anthropic (12 Jun anchor) | 11,423 | 15,861 | 1.39 | 28.92× |
| Claude_(language_model) | 7,852 | 3,458 | 0.44 | 91.20× |
| OpenAI | 7,620 | 2,102 | 0.28 | 145.53× |
Why the range is so wide
A baseline-days ratio factors exactly into a raw ratio × an inverse-baseline ratio. Most of the Anthropic multiple is Anthropic being a 16× larger page — not the July event drawing 16× more traffic.
What we actually claim
The victim page beats every comparator on both metrics. The direction, plus the range — not any single multiple. Quoting “23×” as the result would repeat the error being diagnosed.
The organisations moved. The vocabulary didn’t.
| Season-matched null, 30-day concept excess | Views |
|---|---|
| minimum | 1,360 |
| median | 11,964 |
| maximum | 28,233 |
| observed — 21 Jul + 30 days | 17,699 |
| percentile against the null | 53.8 |
Four AI-risk concept pages: AI_safety, AI_alignment, Artificial_general_intelligence, existential-risk. Generic Machine_learning control: 31st percentile — both inside ordinary variation.
The bounded, honest claim
Not “the vocabulary did not move”. Rather: movement below ~2.2× ordinary drift was undetectable here, and none was detected.
Even bounded that way, it is the result most worth acting on — because a large conversion is exactly what the warning-shot argument needs.
The disclosure was ordinary. The attribution was off-scale.
| Date | Event | Hugging_Face views | vs baseline |
|---|---|---|---|
| 16 Jul | Hugging Face discloses the breach | 856 | 1.22× |
| 17–20 Jul | — | 439–1,144 | flat |
| 21 Jul | OpenAI acknowledges responsibility | 1,767 | 2.5× |
| 22 Jul | press wave | 17,306 | 24.7× |
Against 166 prior days (median 1.00, p90 1.21, max 1.55), 1.22× is the 91st percentile — detectable, top-decile, and entirely ordinary. The victim’s own disclosure of a serious breach moved its page to a level it reaches 9% of days anyway.
Attribution to a named frontier lab moved it to 24.7× — roughly sixteen times beyond the largest daily ratio in the preceding 166 days. The developer’s own page stayed at 0.35 baseline-days.
hypothesis, n=1 Plan for the attention event to fire on attribution to a named lab, not on the victim’s disclosure.
The biggest spike isn’t the incident.
| Date | Driver | Views | vs baseline |
|---|---|---|---|
| 22 Jul | attribution + press wave | 17,306 | 24.7× |
| 27 Aug | two forensic reports and acquisition reporting | 28,026 | 39.9× |
| 3 Sep | Nvidia–Hugging Face deal announced | 34,679 | 49.4× |
The 27 Aug impulse cannot be attributed to the forensics: TechCrunch carried the $12.9 bn acquisition at 06:32 UTC that same day. The largest corporate story in the company’s history lands on the same pageview day as the two reports, and this series cannot separate them.
survives Only the 22 Jul impulse is cleanly attributable to the incident. not testable Whether forensic publication drives a second peak.
An entity page measures a company. Over any horizon long enough to contain a second impulse, corporate news dominates incident news — and the analyst cannot know the truncation point in advance.
A headline-grade finding that fails its own null
Fitting the three channels separately gives half-lives of 7.05 h (Hacker News), 5.45 d (Wikipedia), 6.11 d (GDELT) — a 20.8× spread that reads as evidence attention runs on separate clocks and the field read the fast one. Two tests remove that reading.
| Null half-life across 30 comparable front-page threads | min | p25 | median | p75 | max |
|---|---|---|---|---|---|
| hours | 5.76 | 6.88 | 7.69 | 8.80 | 16.94 |
withdrawn The spread
The incident’s thread is 7.05 h → 33rd percentile, rank 10 of 30. It decays more slowly than the median thread. The number measures Hacker News, not the event. And a direct ratio bootstrap of lookups vs media gives 1.120, CI (0.788, 1.740) — contains 1.
survives What remains
Every front-page aggregator thread turns over in about eight hours — exactly as Wu & Huberman reported in 2007. So a conversion scorecard read at 48 hours is always reading a channel that closed a day and a half earlier, whatever the event.
Every surviving number, re-tested against its strongest objection
| Objection | Test | Outcome |
|---|---|---|
| Log-space OLS is biased | refit by raw-scale NLS | magnitudes move up to 2.7×; ordering invariant |
| Residuals autocorrelated | moving-block bootstrap | intervals widen 3–18%; all verdicts unchanged |
| Entity page contaminated | drop the Kimi-K3 release days | half-life 5.450 → 5.413 d (0.99×) |
| Breakpoint chosen by search | charge 2·ln C to AIC | two of three channels survive, not three |
| Null not season-matched | rebuild from prior-year Jul–Sep | 68.2 → 53.8; matched figure reported |
| Comparison uses raw views | recompute in baseline-days | 1.46× raw, 23.06× normalised; both reported |
| Overlapping intervals used as a test | bootstrap the ratio directly | (0.788, 1.740) — contains 1 |
| Half-life may be platform-typical | null over 30 threads | 33rd percentile — claim not supported |
What this does not establish — and how it could be misused
Limitations
- n = 1 event, one matched control. The implications are hypotheses, not laws.
- Proxy validity. Pageviews measure lookups, not awareness. The entity page measures a company.
- Small nulls. 13 overlapping windows collapse to a handful of independent samples. 53.8 is a location, not a p-value.
- Estimator dependence. Half-lives move up to 2.7×; no single one is “the” quantity.
- The rule is retrospective. “Count the absorbing page” is an argmax over the outcome — a diagnostic, not an estimator.
Dual-use
The same finding that shows attribution drives attention could be read by a lab as an argument for delaying or diffusing attribution — and the counting result as an argument for steering coverage toward whichever page is least likely to register it.
We state it openly because it is already the incentive gradient labs face; because a public, checkable estimate is more useful to regulators, journalists and the breached party than to the one actor deciding whether to delay; and because it cuts symmetrically — it is equally an argument for a regime where attribution is timely by requirement rather than by choice.
No non-public data. No live system touched. No model capability involved. Nothing that lowers the cost of running an incident, and nothing that identifies a person.
What a communications team should do differently
1 · Declare the counting rule
Before asking how far an incident travelled, say whose page counts as “it”, in what units, against what null. For short windows some candidates — the event article — don’t exist yet.
2 · Don’t read the bubble’s clock
Every front-page thread closes in ~8 hours. A scorecard at 48 hours measures a channel that shut a day and a half earlier. That’s a property of the medium.
3 · Expect no vocabulary shift
The organisations moved; the concepts did not, to the limit of what we could detect. A large conversion is what the warning-shot argument needs, and there wasn’t one.
What survives is a measurement discipline rather than a story — state whose page you counted, in what units, against what null. Then most of what can be said about a warning shot’s reach becomes checkable rather than arguable.
$0, no credentials, no network
# clone, install, check
pip install -e ".[dev]"

python -m pytest              # 124 tests, no network
python scripts/verify.py      # 121 checks vs committed results

# regenerate the analysis
python scripts/run.py all
python scripts/robustness_suite.py
python scripts/nulls_and_controls.py
python scripts/power_and_comparators.py
Fatimah Emad Eldin ·
Fatimah@trouve.works · Trouvé Works
Paper: paper/main.pdf — 8-page body, references
and appendix excluded.